Rust + Axum
A reusable edgar-core library — typed statements, diff, sentiment, verification badges — behind a server-rendered Axum site.
The research workspace for investors who read filings
Provenance pairs a verified financial-data layer — where each figure carries an auditable chain back to the legal filing — with a serious text-analysis toolkit for the prose of SEC filings.
It independently extracts financials from the audited HTML, cross-checks them against the XBRL that every data vendor relies on, and shows you — in one click — exactly where any number came from.
Six things no other tool does at any price near this
The verification layer is why you can trust it. The workspace is why you'd open it every day.
01 · Verification layer
Income statement, balance sheet, and cash flow render as clean, interactive tables — and every figure wears a verification badge. Click it and the embedded viewer scrolls to and highlights the exact line in the original 10-K. Not a reformatted copy. The audited legal document.
Why it matters — a Bloomberg user can't click a revenue figure and land on the highlighted line in the filing. That single click is the whole proposition.
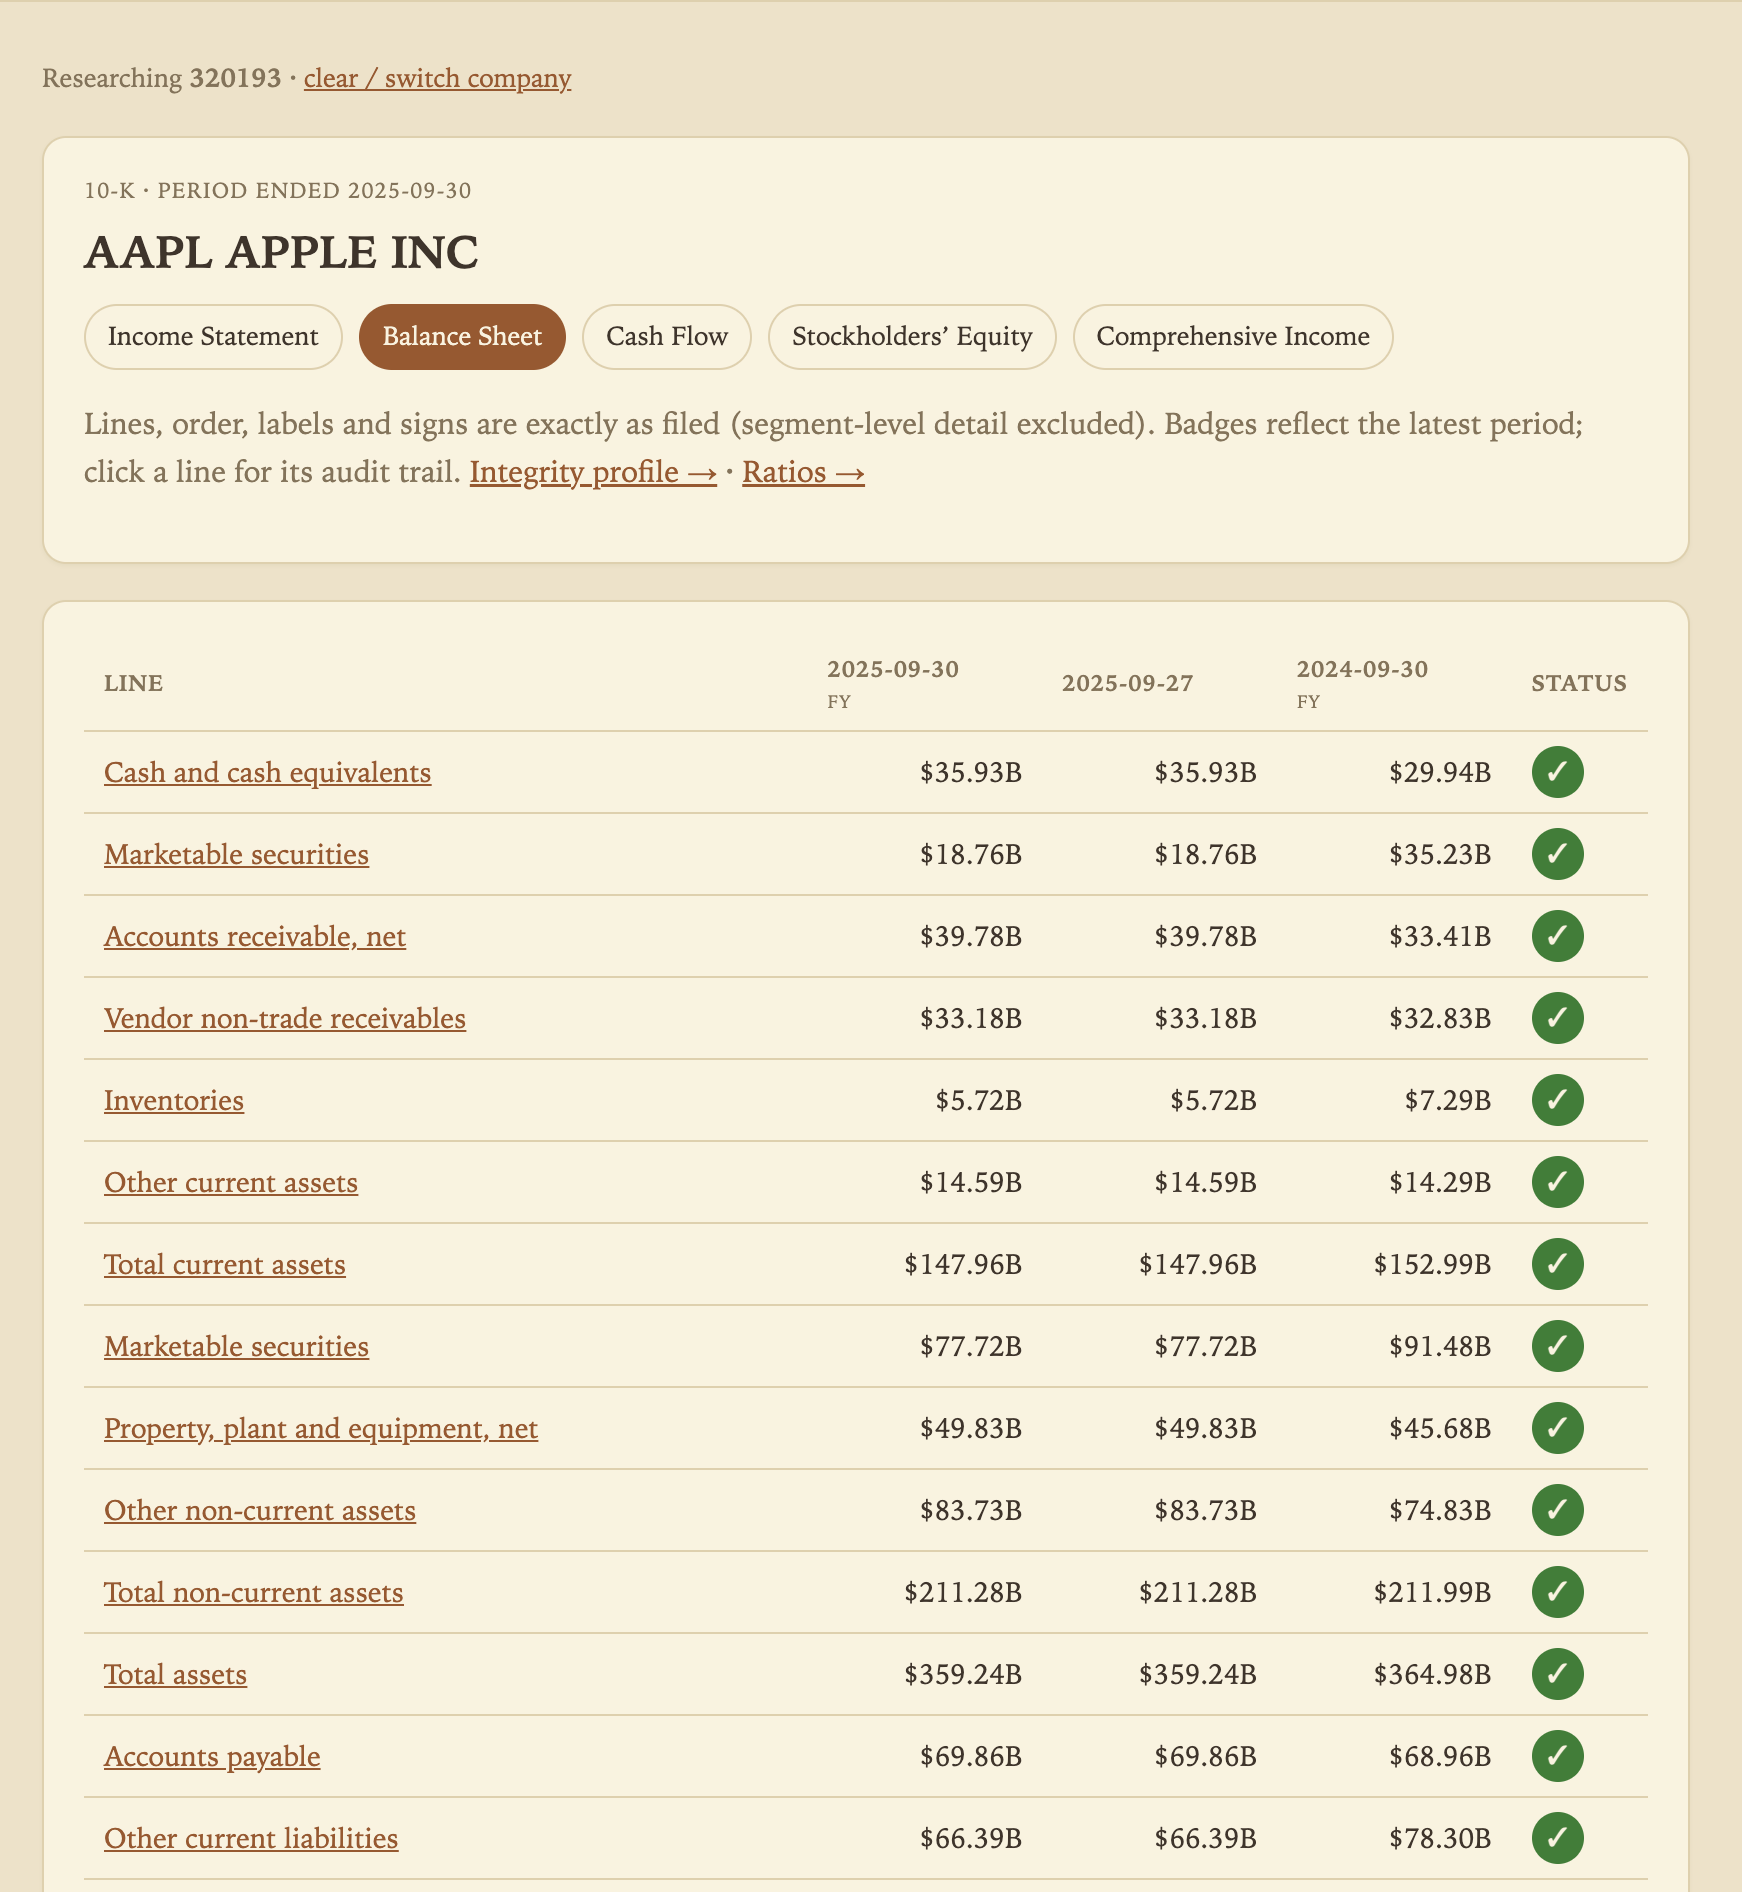
/statement) with the Verified badges.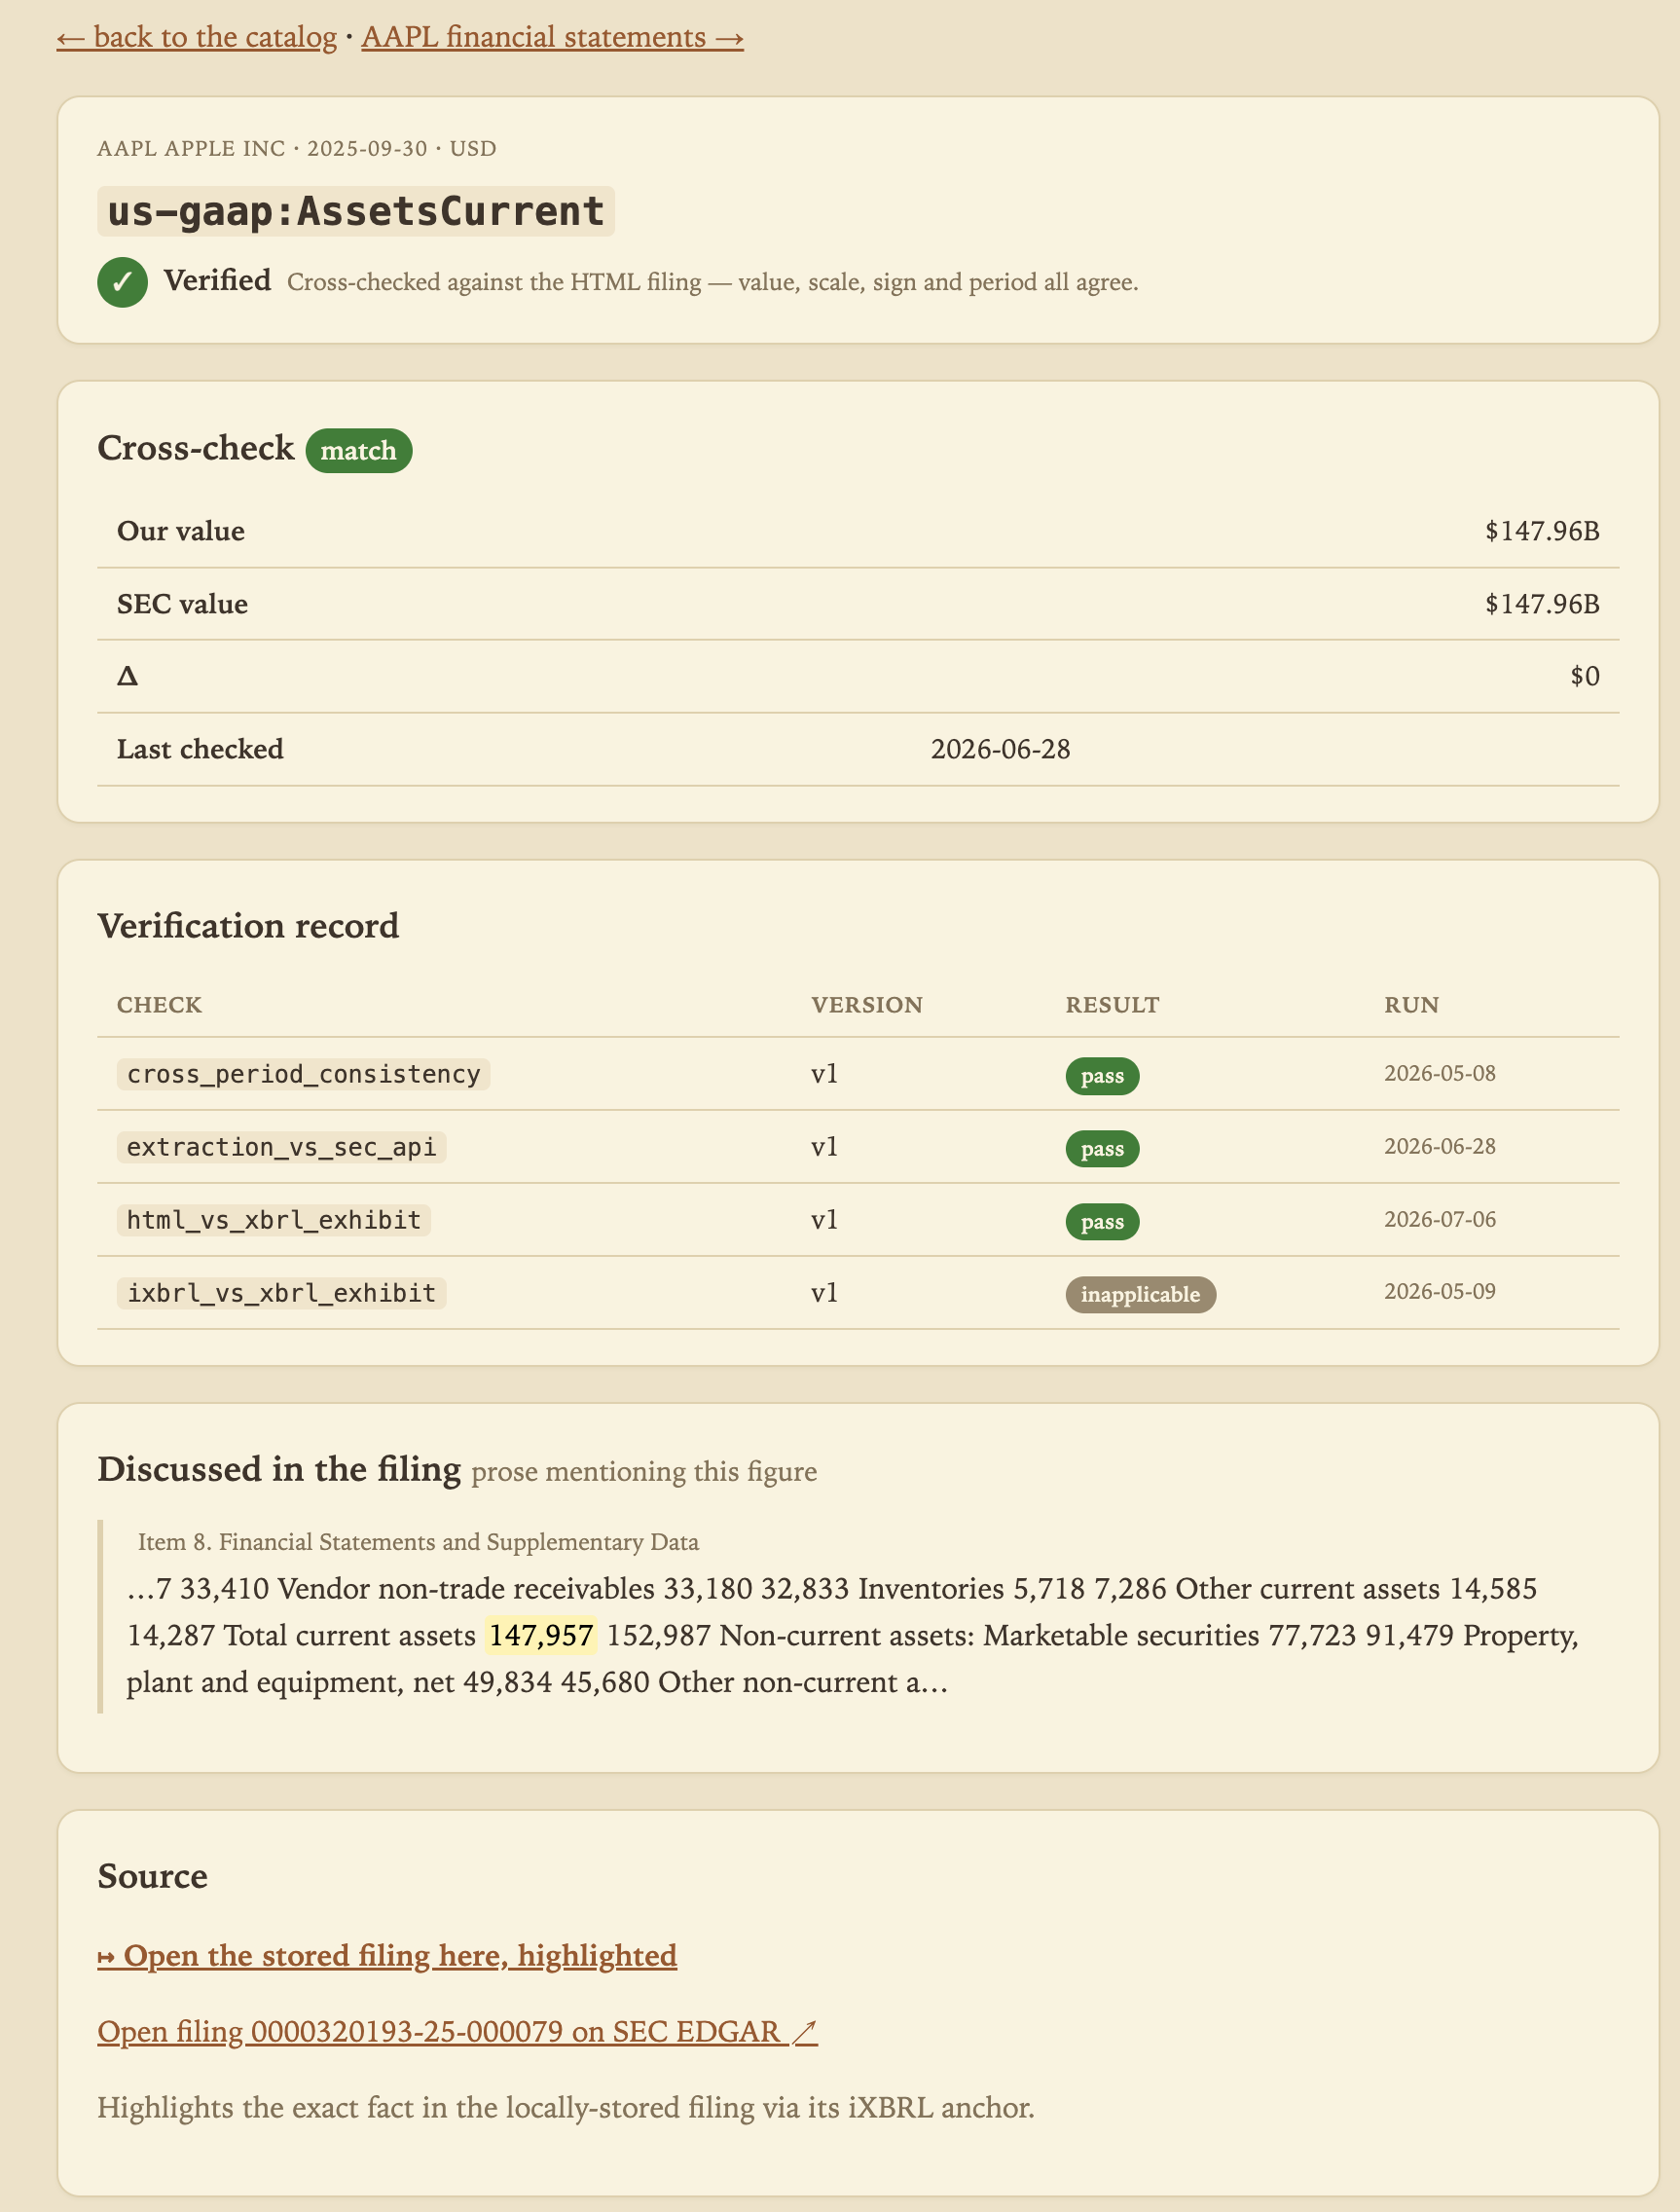
/fact) — cross-check & checks.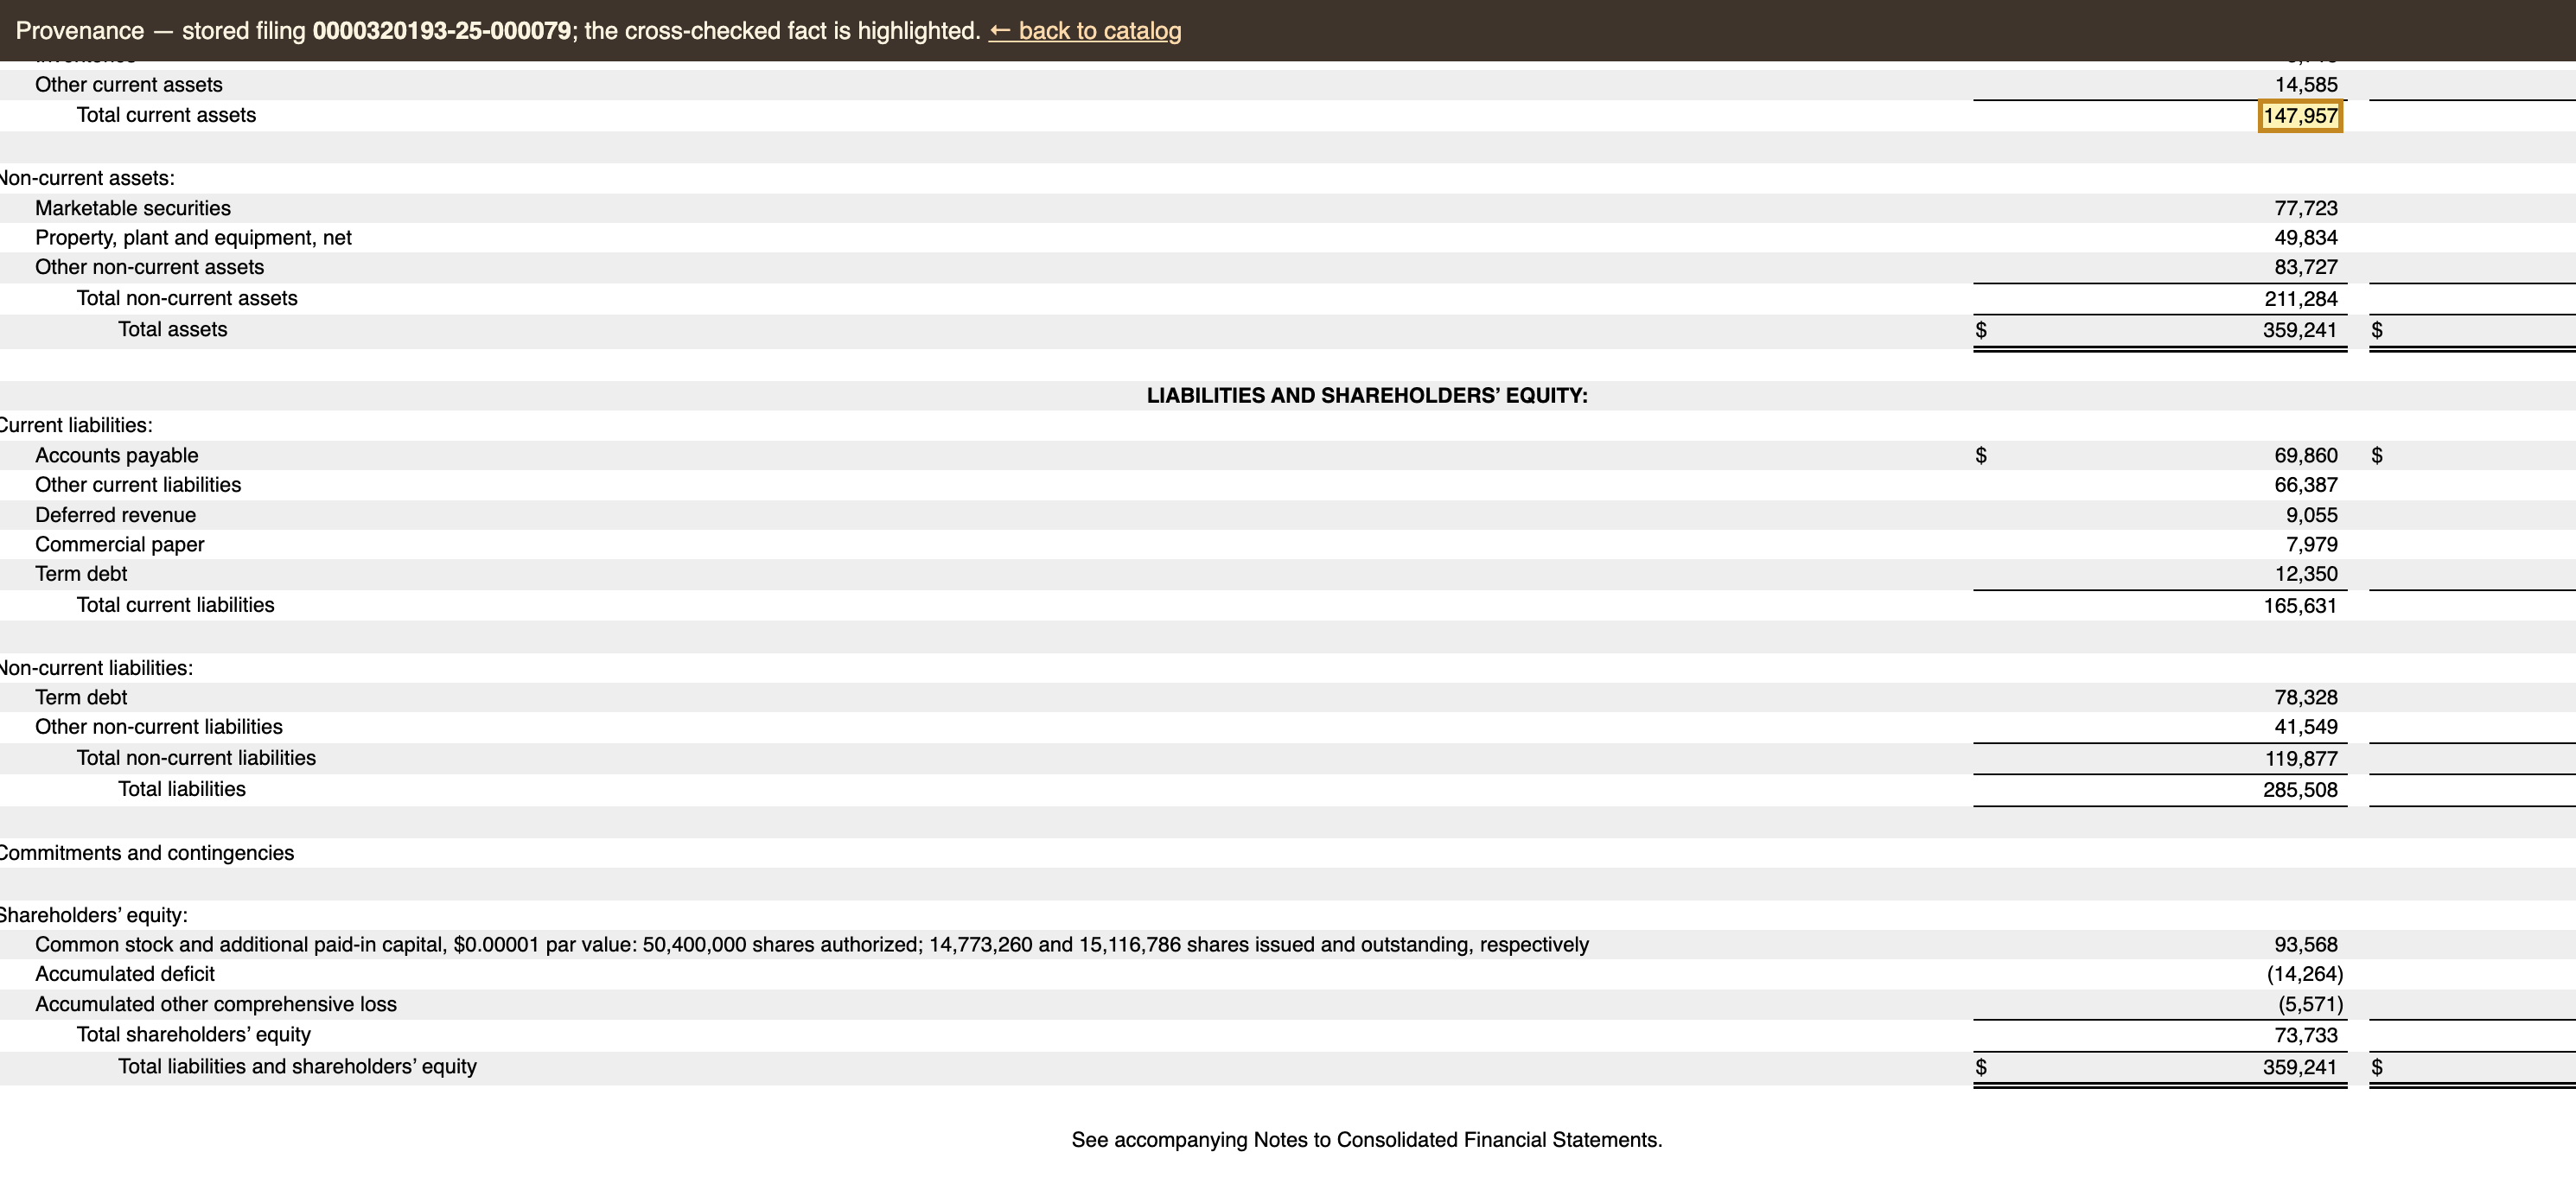
/source).02 · Verification layer
Provenance extracts financials from the HTML independently, then cross-checks them against the XBRL data every vendor treats as ground truth. Each disagreement is cataloged and filterable by company, concept, and magnitude — the class of error that lets figures like 500 trillion shares slip into a database unnoticed.
Why it matters — good analysts have caught vendor data errors by hand before. This surfaces them systematically, across the whole corpus.
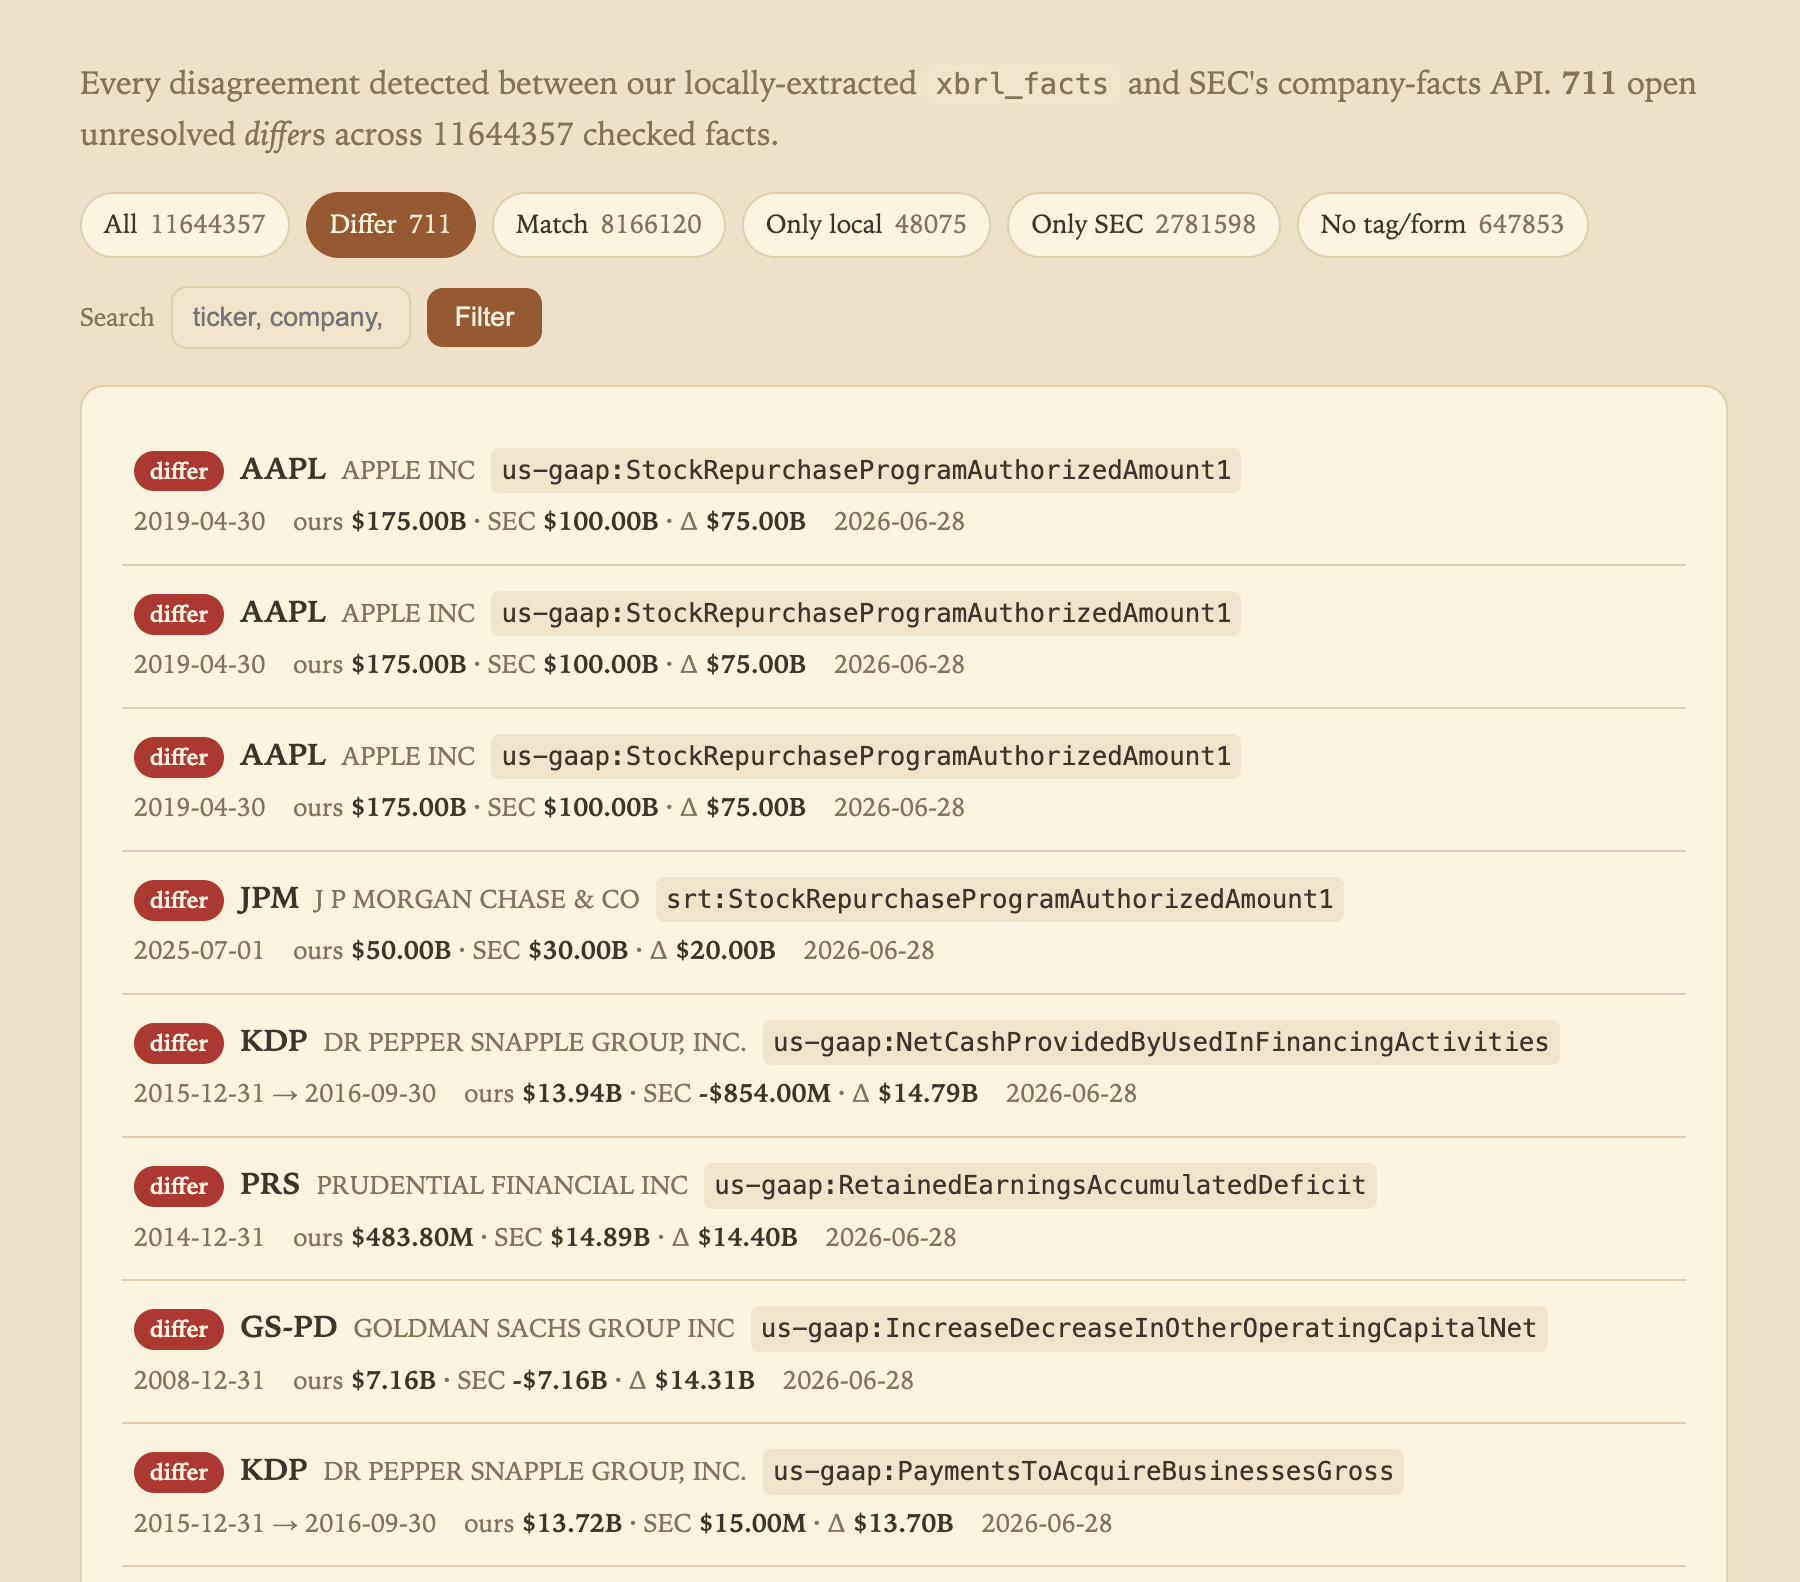
/discrepancies catalog — a table showing both values, magnitude, and status. Pick a company with a striking disagreement.
03 · Research workspace
Pull any prose section — Risk Factors, MD&A, Business, Notes — beside last year's. Additions in green, deletions in red, paragraph by paragraph. See exactly what was added, removed, and rewritten. Changes in risk-factor language routinely precede the events they describe.
Why it matters — year-over-year prose diffing is otherwise only found inside a terminal that costs $10,000 a year.
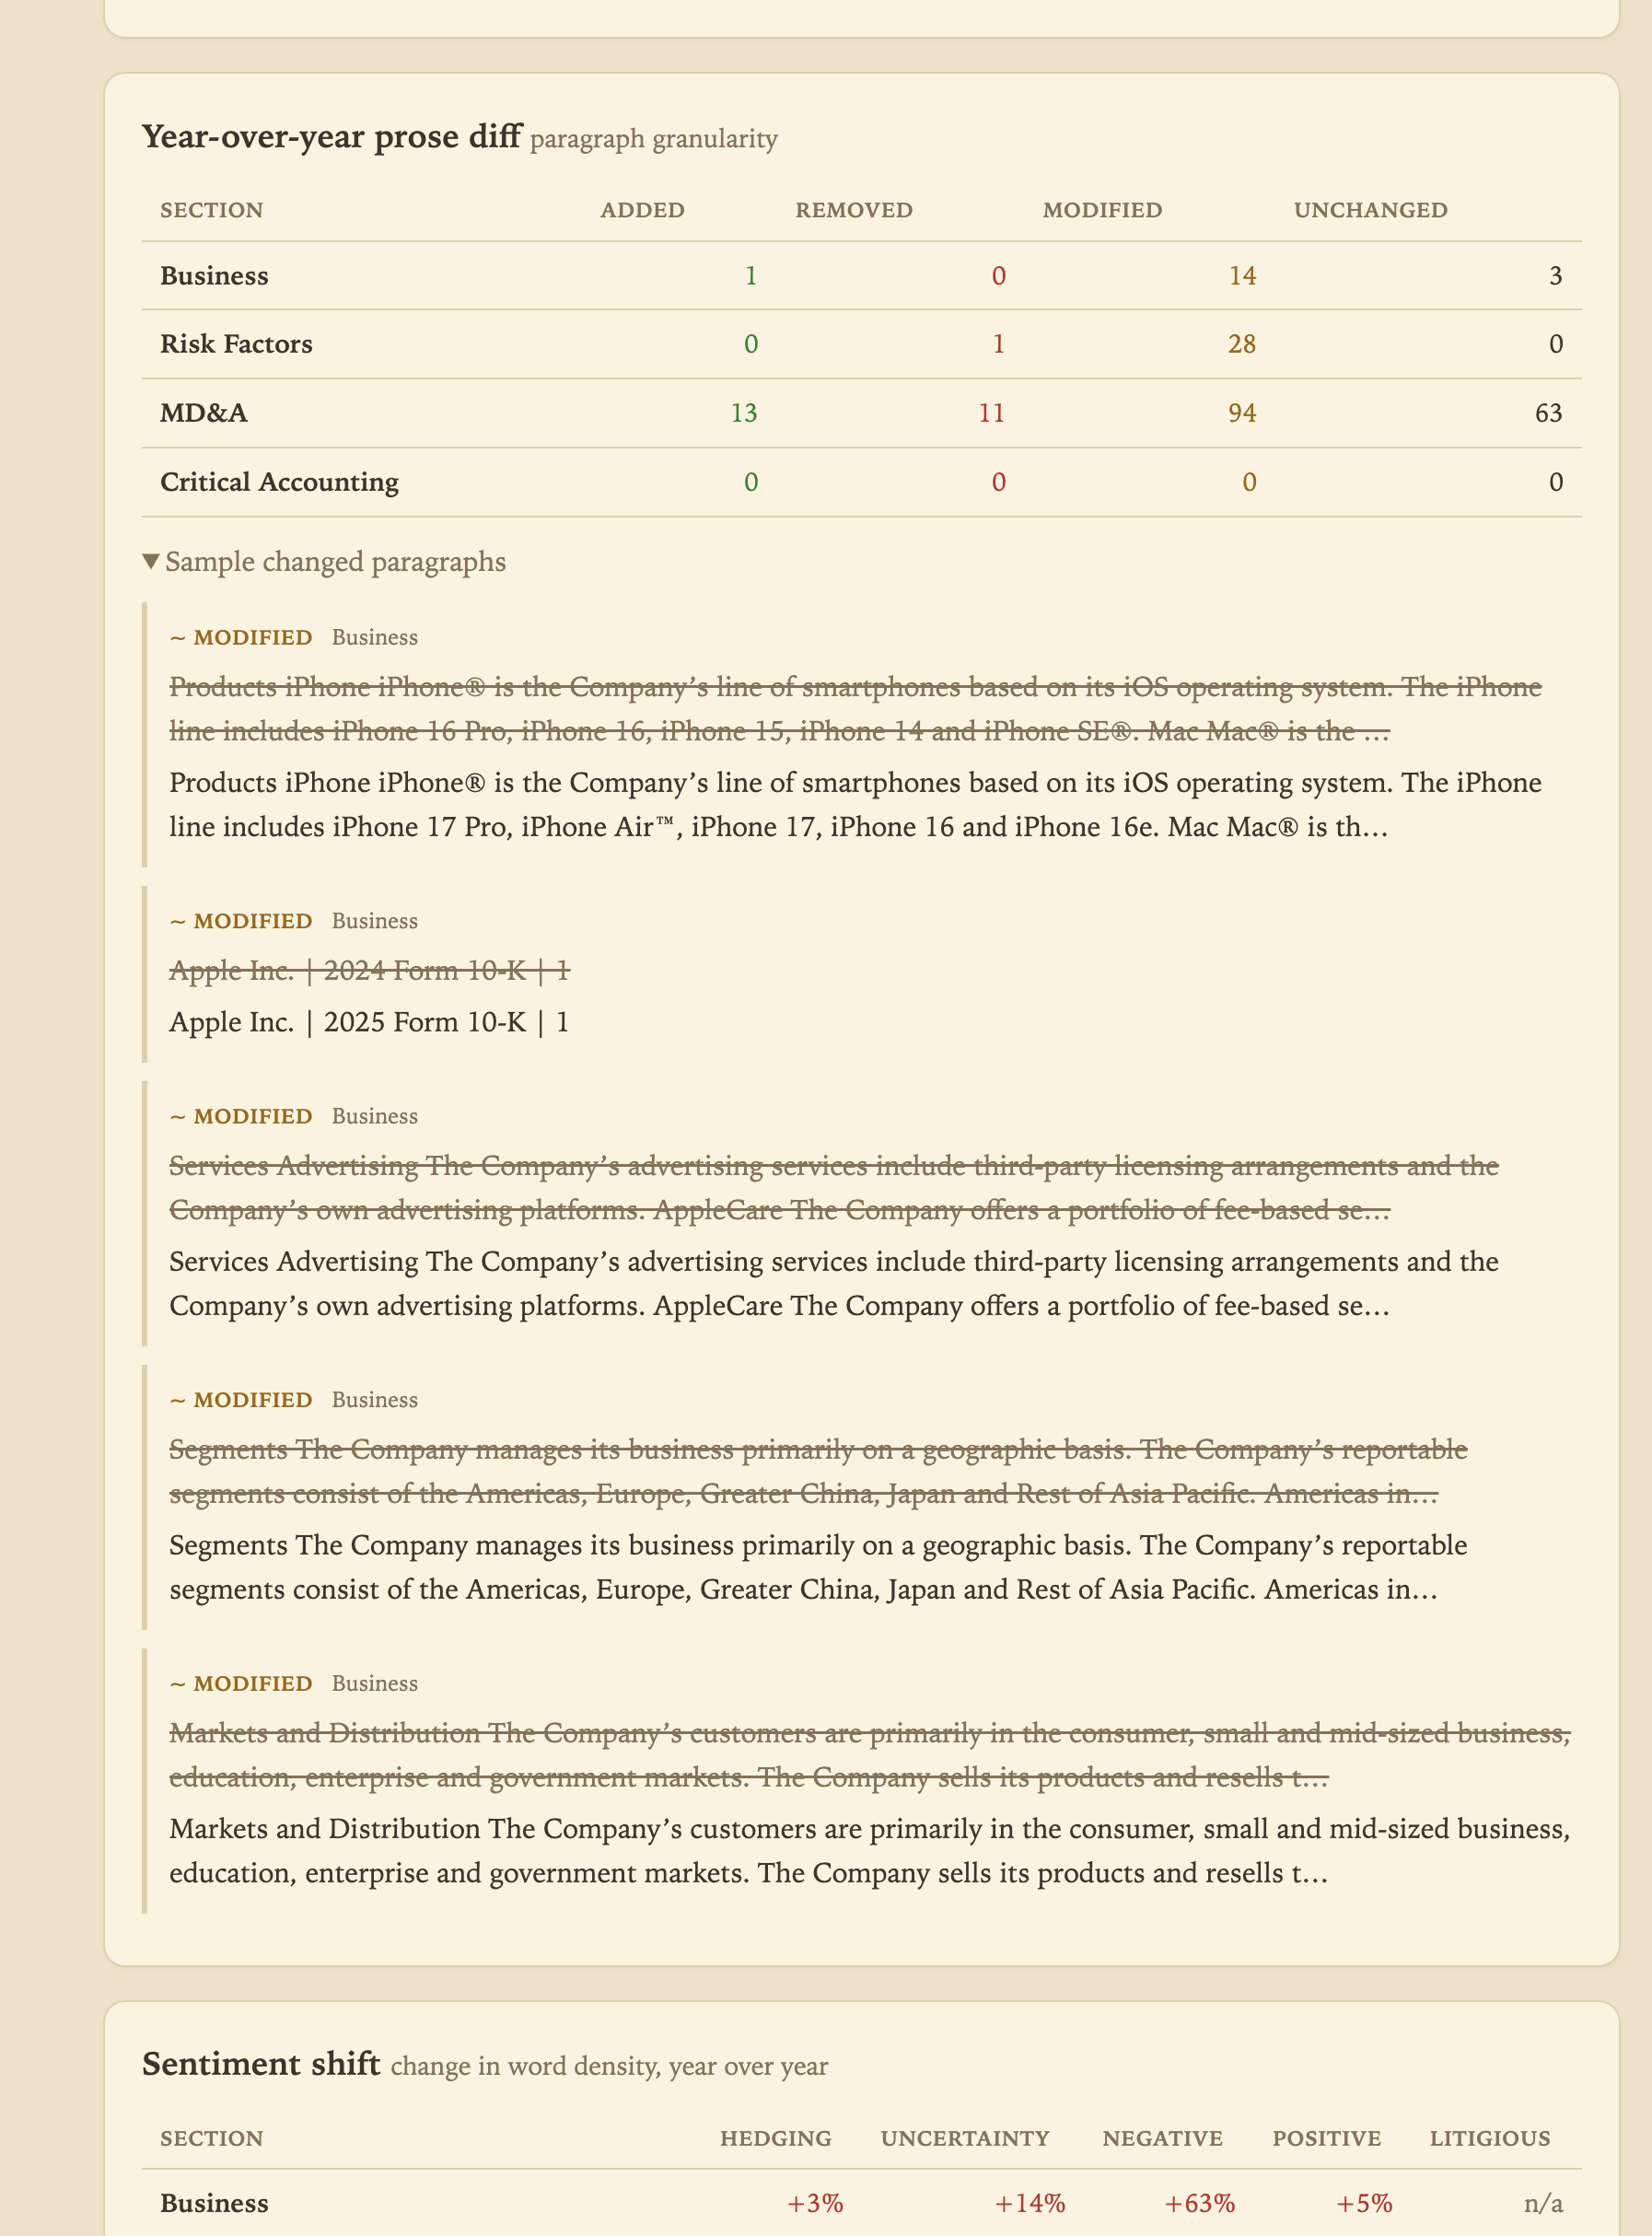
/diff view on Risk Factors or MD&A — show a screen with visible green additions and red deletions.
04 · Research workspace
Not just "ROIC is 14.3%." ROIC = NOPAT / Invested Capital — expanded down to each underlying figure, and every leaf of the tree links back to the highlighted line in the filing it was drawn from. No black boxes, no vendor methodology you can't inspect.
Why it matters — "here's exactly how I calculated it, traced to the audited filing" is the fiduciary's version of showing your work.
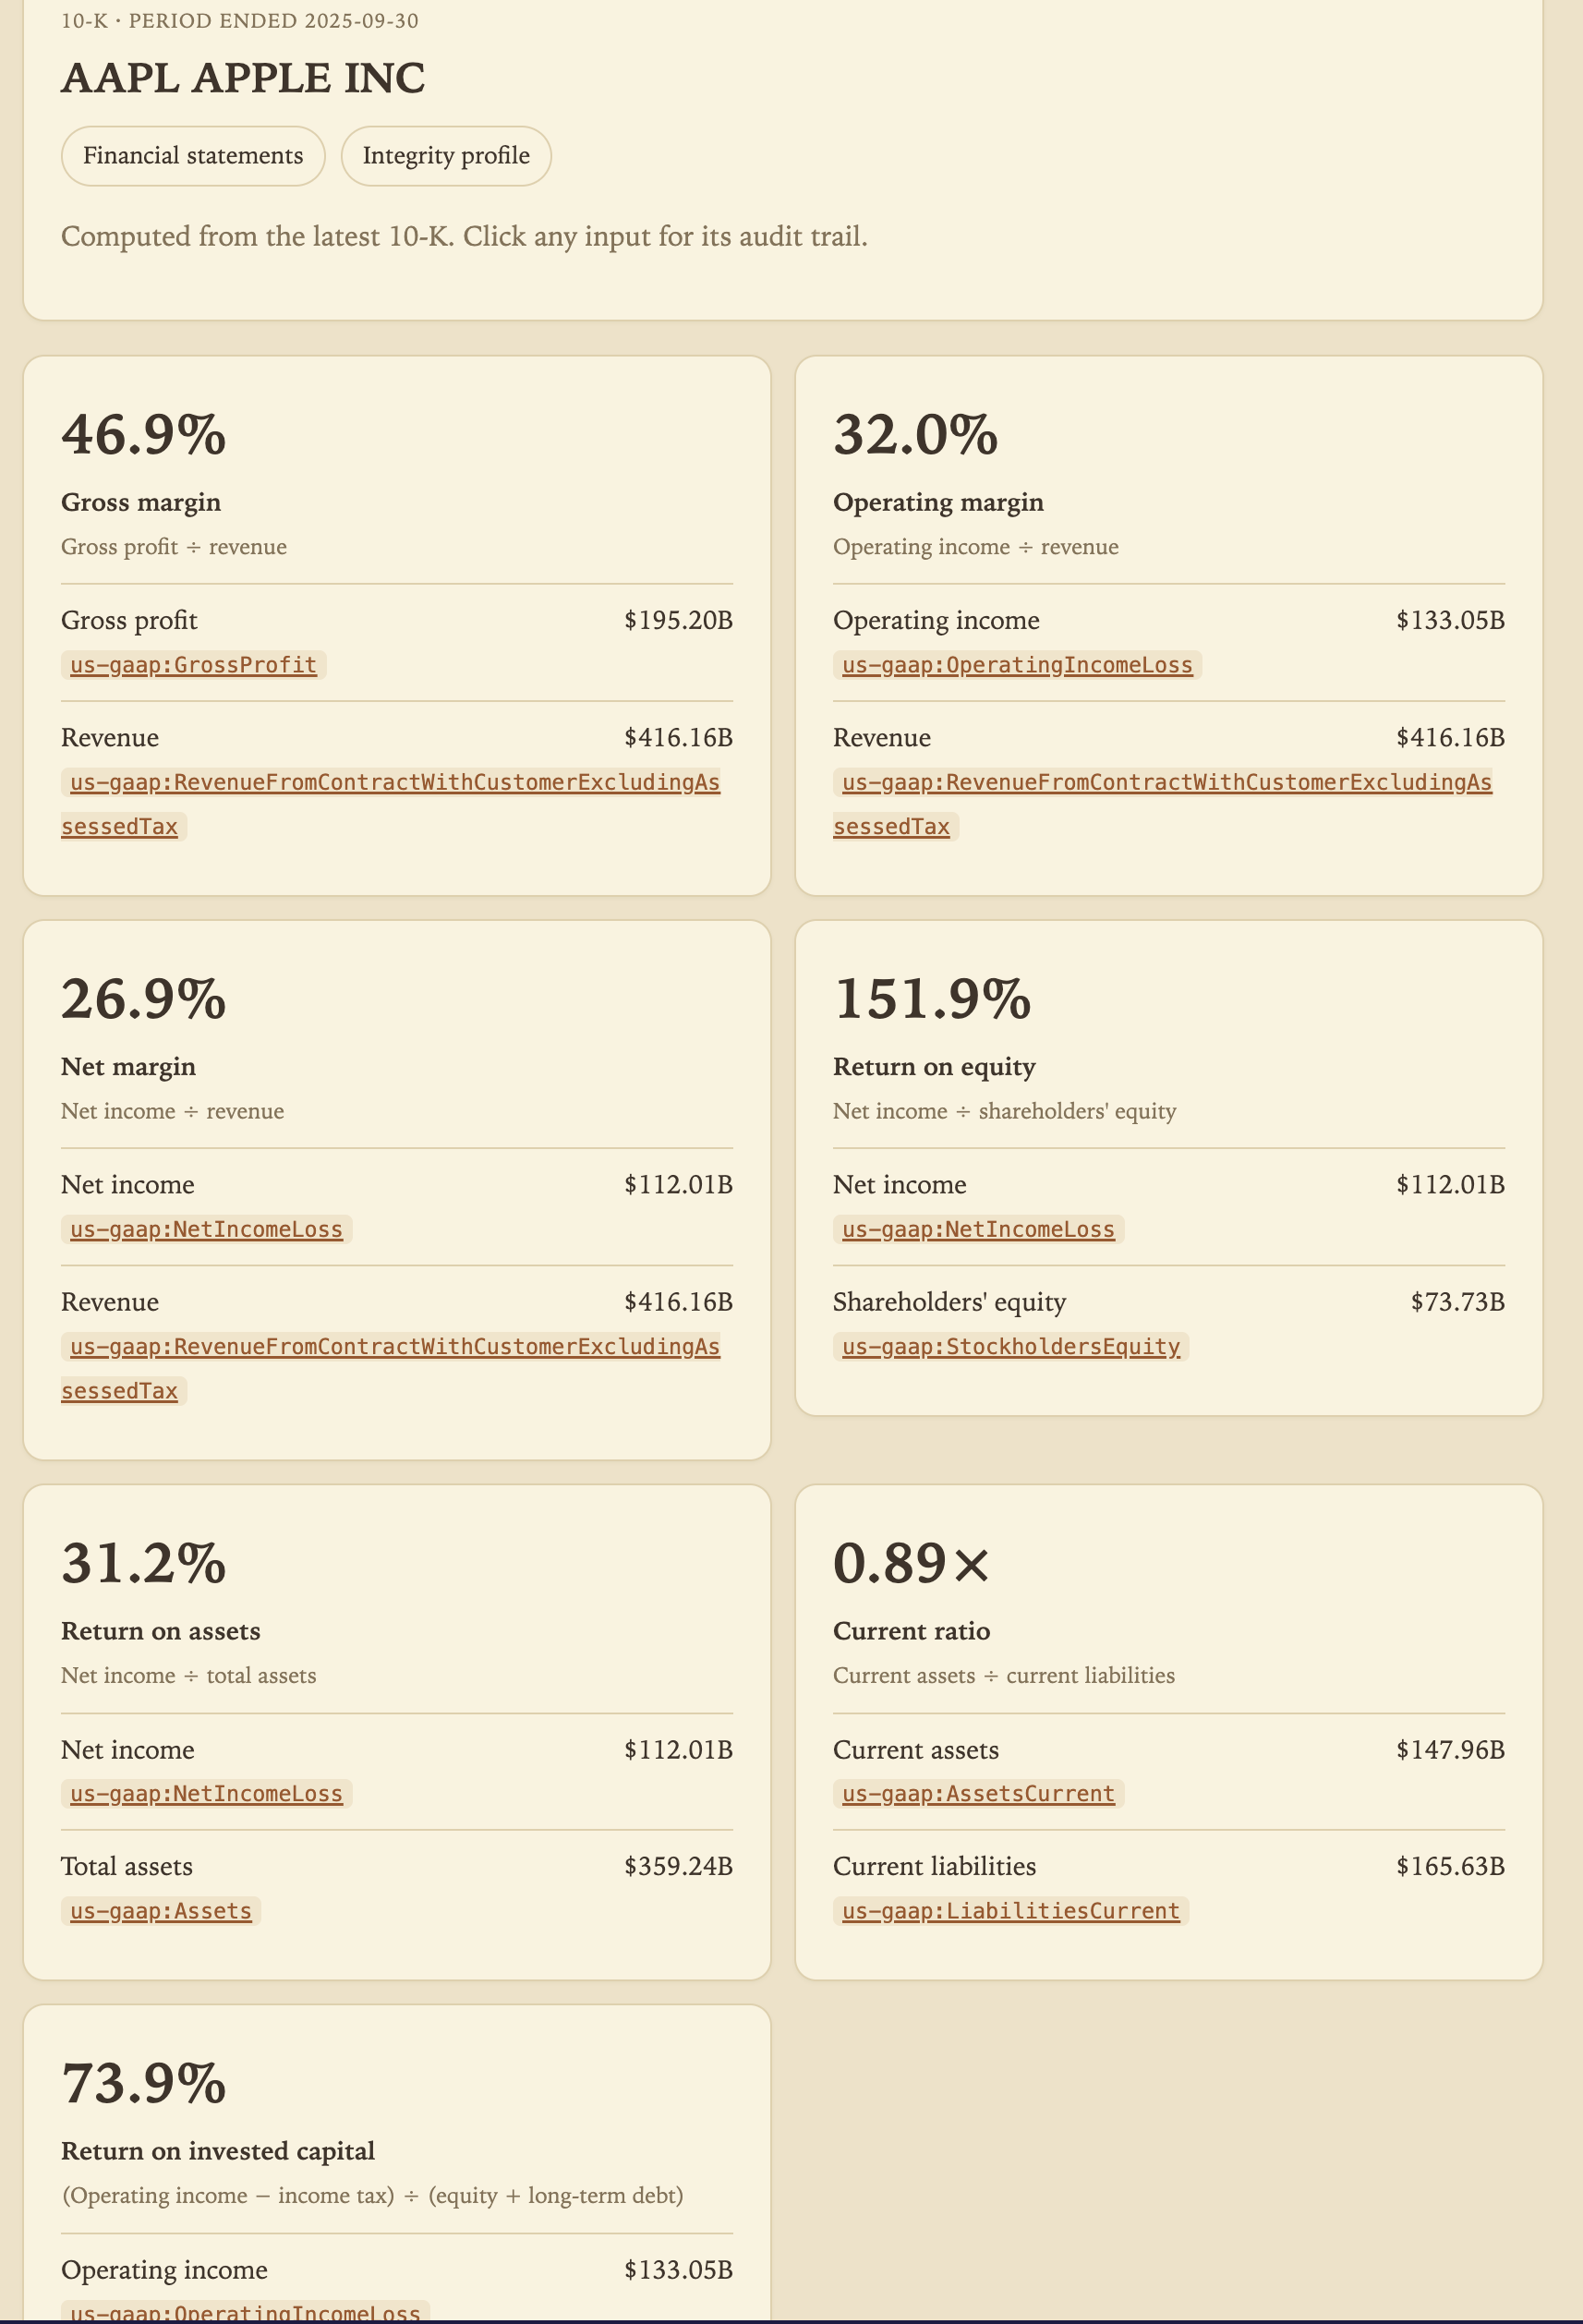
/ratios view with a ratio expanded into its components, source links visible on the leaves.
05 · Research workspace
Combine quantitative and language criteria freely — "accruals ratio above 0.10 for three of five years AND a newly added risk factor." Every hit traces back to source: quantitative values to the input facts and their filing, NLP signals to the triggering passage.
Why it matters — quant screens and text screens have never lived in the same query, let alone one where every result is traceable.
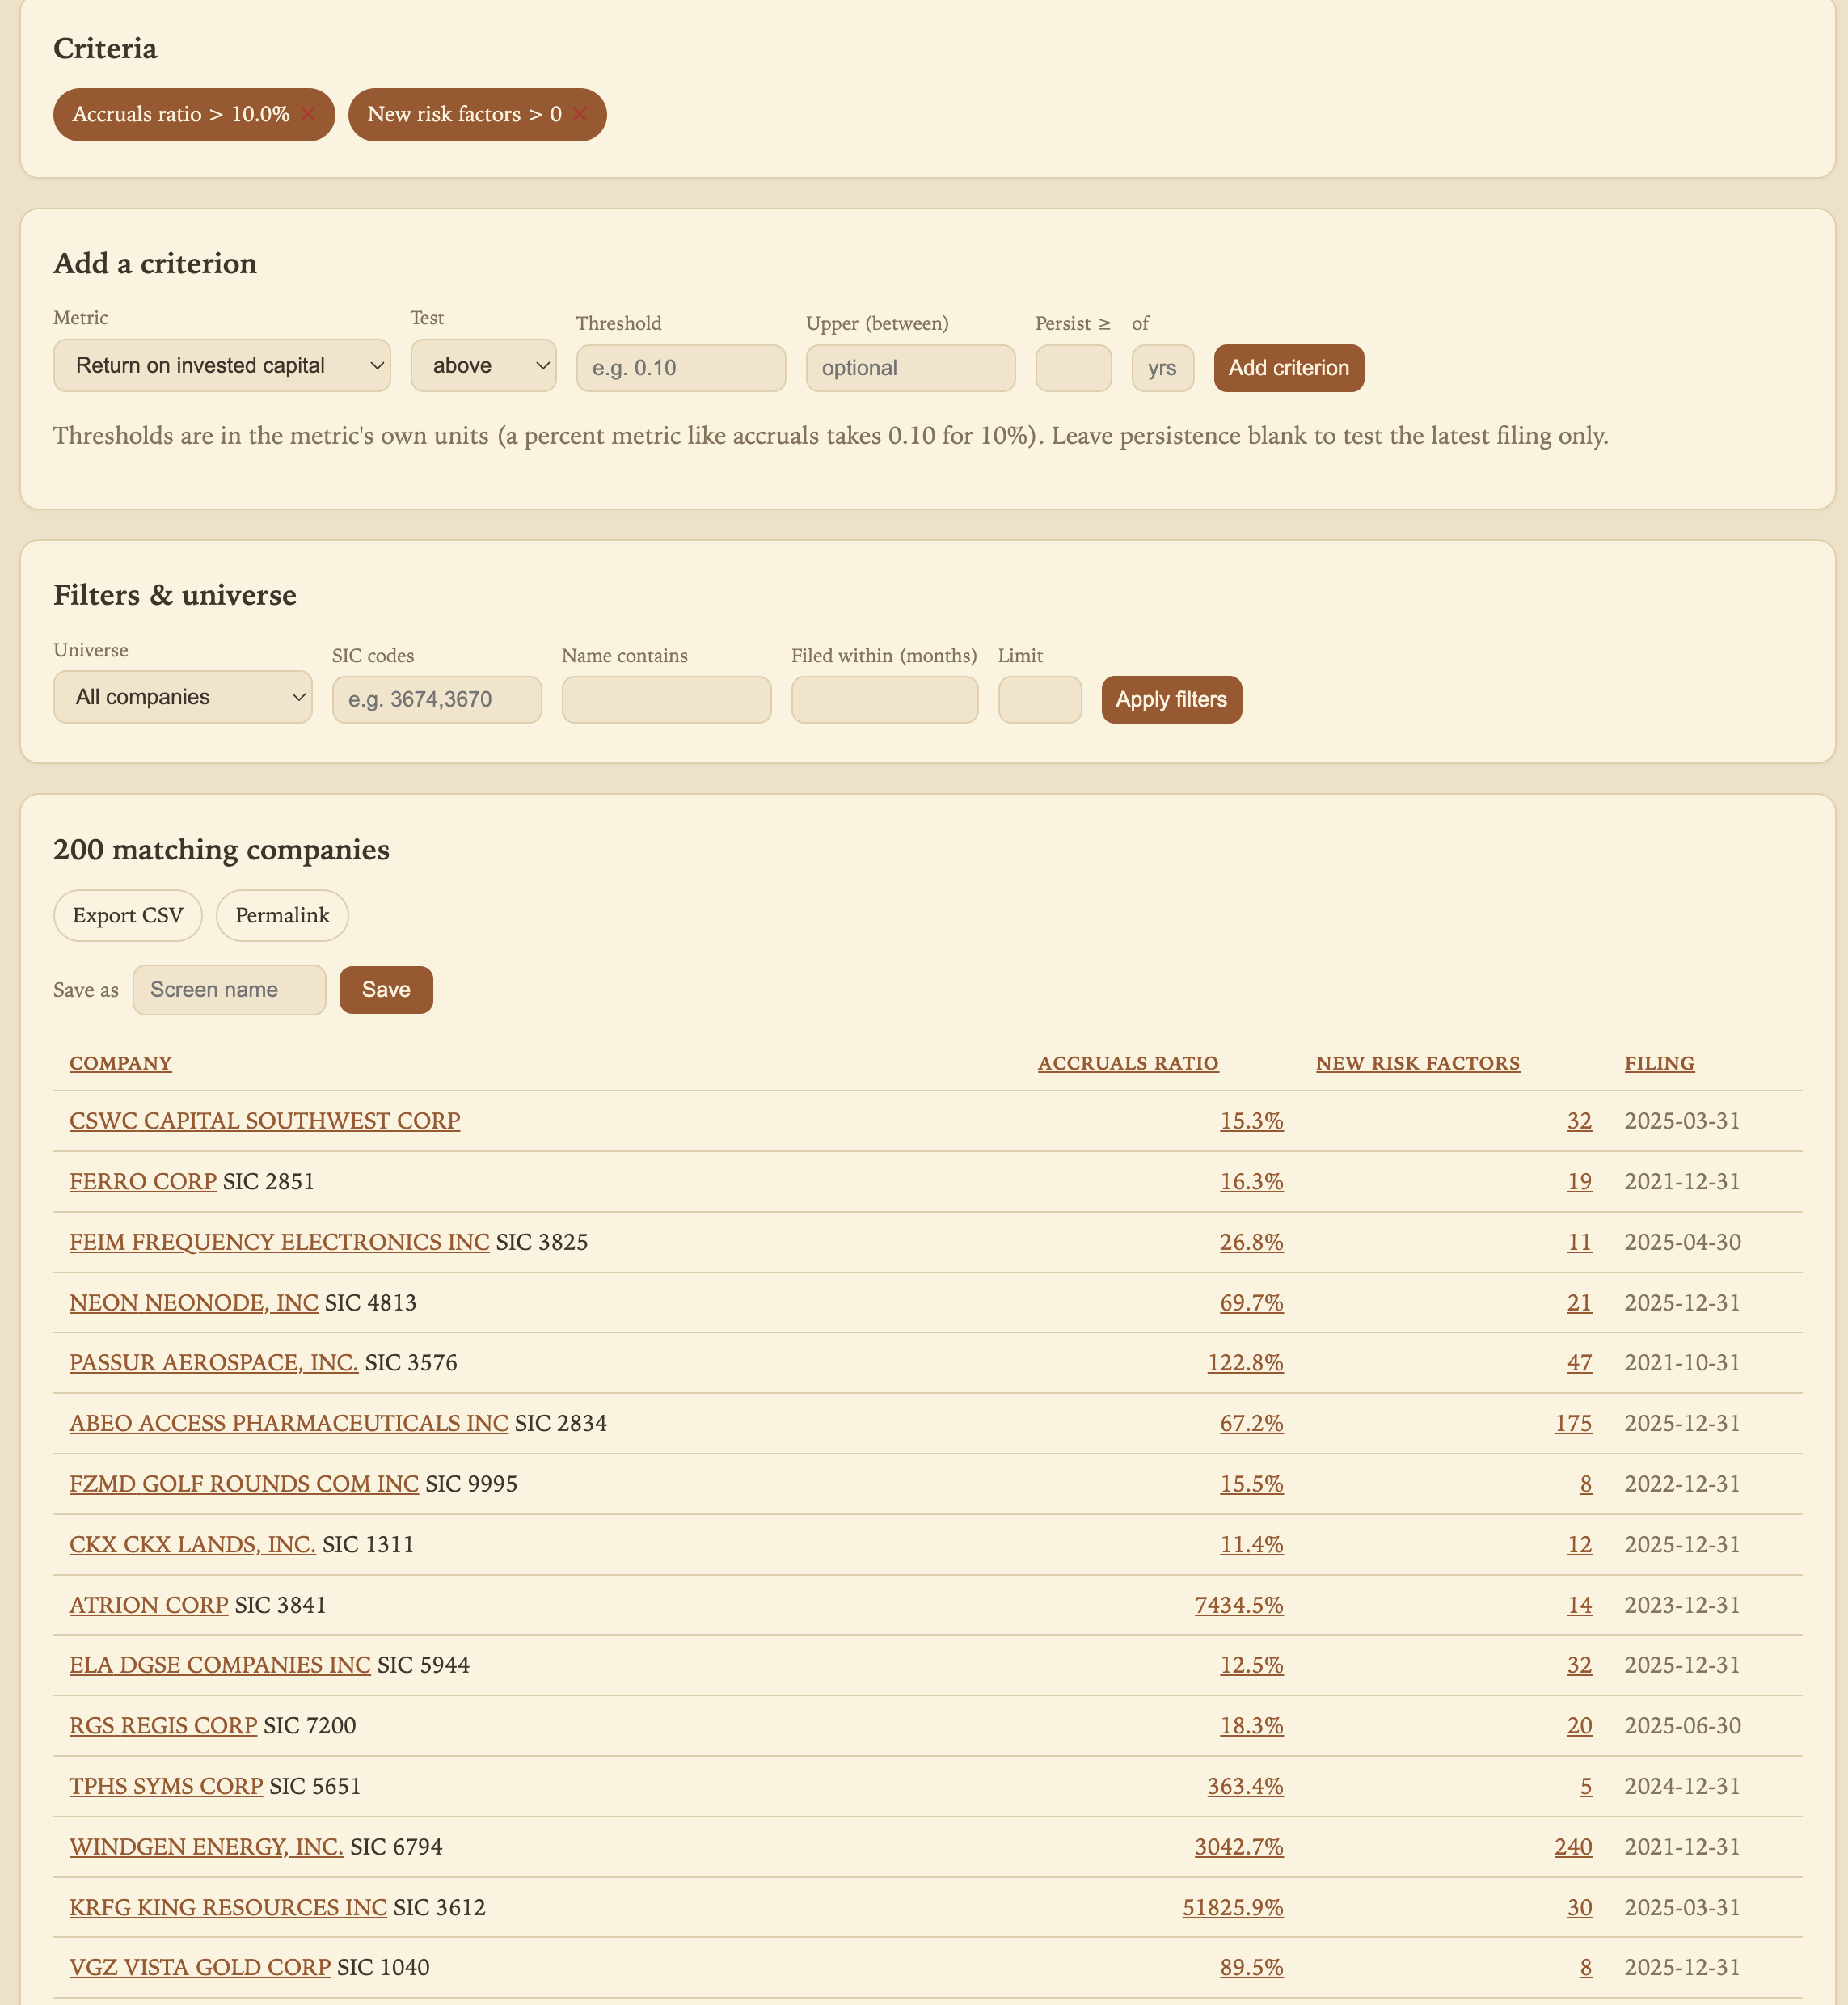
/screen builder with a combined quant + NLP screen and its ranked results — ideally with a "why" trace visible.
06 · Research workspace
A per-company transparency dashboard: how many XBRL discrepancies across its filing history, whether it has restated, how often it reaches for non-standard tags, how much its risk language shifts year to year. Not a score or a rating — the evidence, laid out, so you form your own judgment.
Why it matters — data quality is itself a signal. A company that constantly restates and mistags is telling you something.
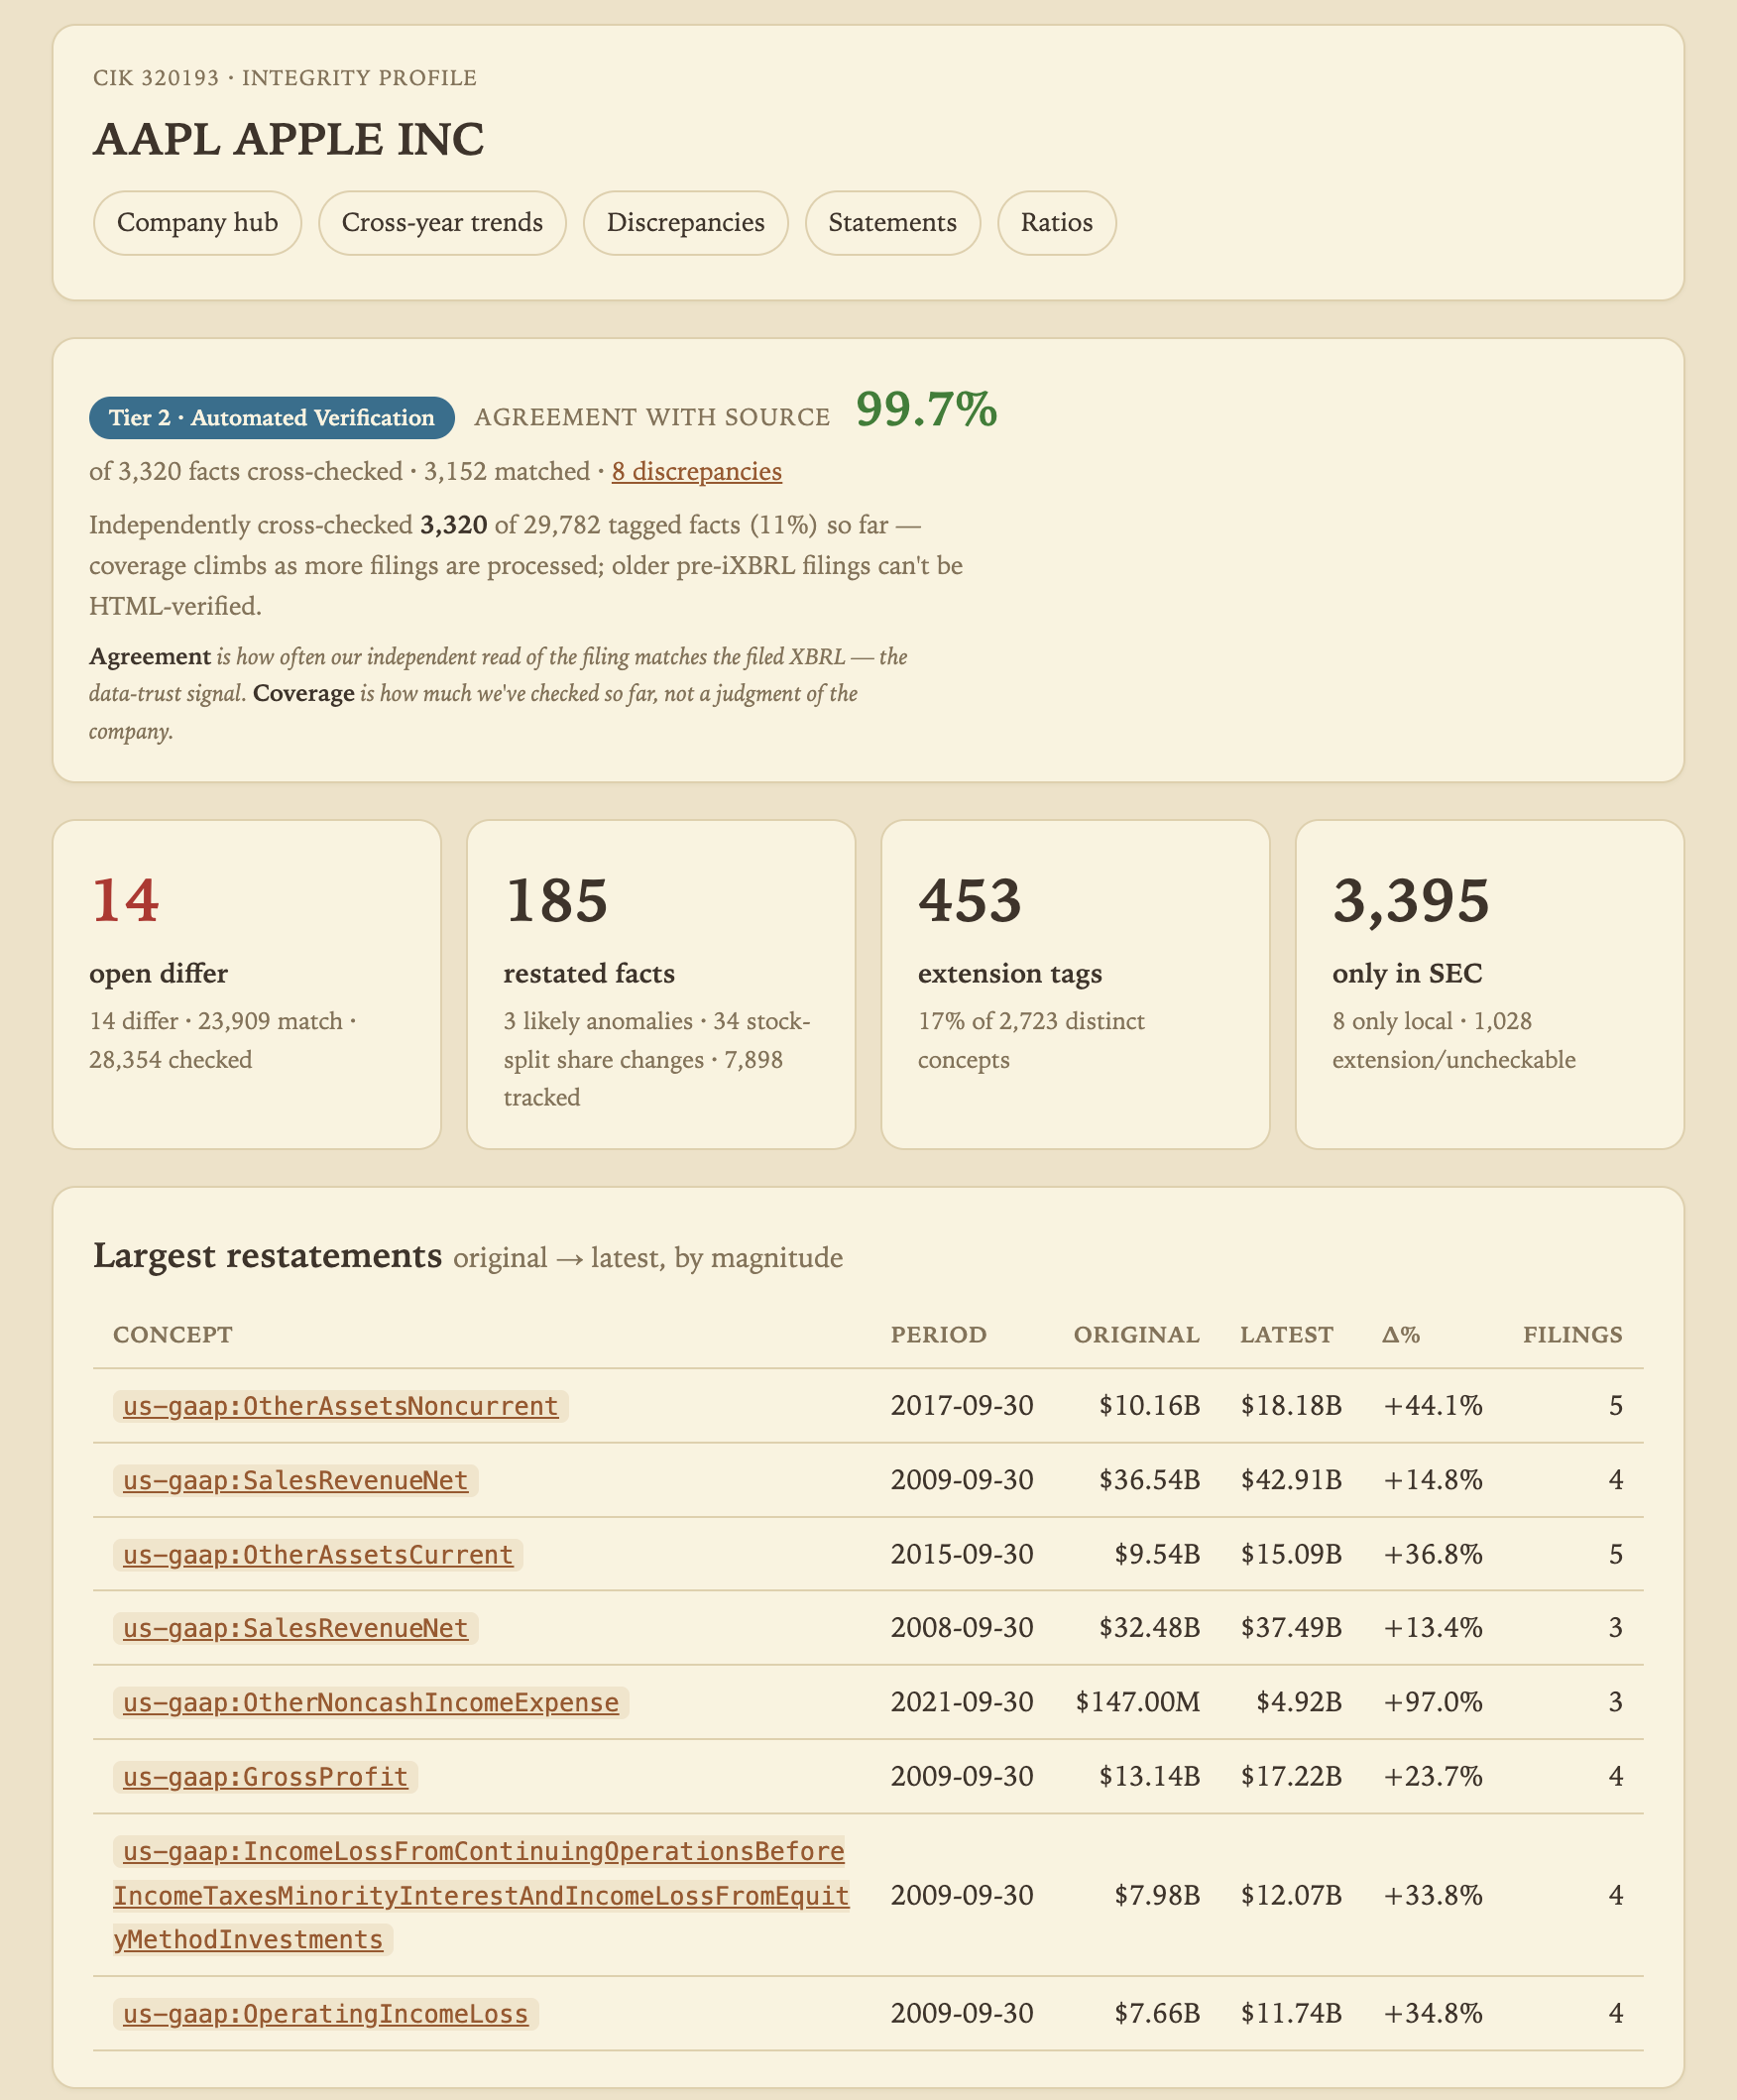
/integrity dashboard for one company — discrepancy count, restatement flag, extension-tag usage, prose volatility.
The gap in the market
Bloomberg and FactSet source from XBRL and normalise it behind opaque methodology. Calcbench traces to the XBRL tag, not the filing. AlphaSense runs NLP on text it never verified. Provenance does all five.
Under the hood
The HTML extraction pipeline and cross-validation engine are the parts nobody wants to build from scratch — and the moat.
A reusable edgar-core library — typed statements, diff, sentiment, verification badges — behind a server-rendered Axum site.
A Python extraction sidecar on edgartools ingests filings, extracts sections, and pulls facts from both iXBRL anchors and raw HTML.
Independent html_facts compared against xbrl_facts, every delta written to a discrepancy catalog with a full check inventory.
Companies, filings, facts, sections, restatement chains, fact checks, coverage targets, and the precomputed screening tables.
Prose diff, sentiment overlay, and badge derivation are pure compute — the data types and analysis primitives build with no database or Python at all.
A live view of how complete and verified the corpus is against a defined universe — a pipeline funnel down to per-company × year.